Datei:Correlation function.svg

Größe der PNG-Vorschau dieser SVG-Datei: 600 × 600 Pixel. Weitere Auflösungen: 240 × 240 Pixel | 480 × 480 Pixel | 768 × 768 Pixel | 1.024 × 1.024 Pixel | 2.048 × 2.048 Pixel | 765 × 765 Pixel.
Originaldatei (SVG-Datei, Basisgröße: 765 × 765 Pixel, Dateigröße: 69 KB)
Beschreibung
| Beschreibung |
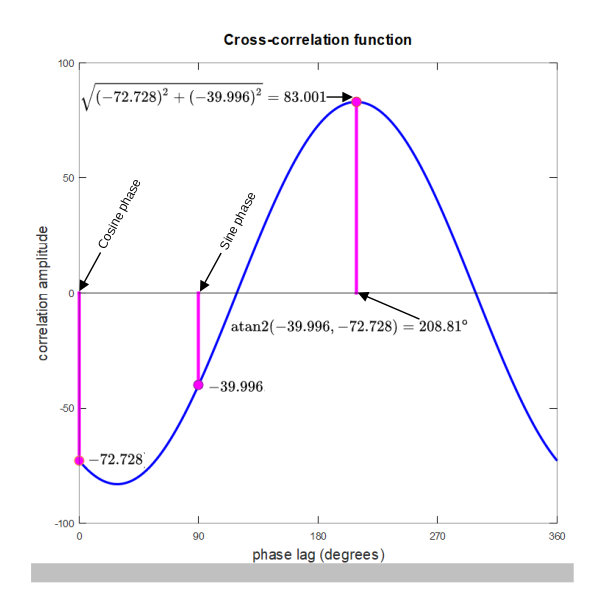
English: The blue curve is the cross-correlation of a square wave and a cosine function, as the phase lag of the cosine varies over one cycle. The amplitude and phase lag at the maximum value are the polar coordinates of one harmonic in the Fourier series expansion of the square wave. The corresponding Cartesian coordinates can be determined by evaluating the cross-correlation at just two phase lags separated by 90º. |
|||
| Datum | ||||
| Quelle | Eigenes Werk | |||
| Urheber | Bob K | |||
| Genehmigung (Weiternutzung dieser Datei) |
Ich, der Urheber dieses Werkes, veröffentliche es unter der folgenden Lizenz:
|
|||
| SVG‑Erstellung | Diese W3C-invalide Vektorgrafik wurde mit LibreOffice erstellt. |
|||
| Gnu Octave source | click to expand
This graphic was created with the help of the following Octave script: graphics_toolkit gnuplot
pkg load signal
#{
The gnuplot graphics toolkit is not actively maintained and has a number
of limitations that are unlikely to be fixed. Communication with gnuplot
uses a one-directional pipe and limited information is passed back to the
Octave interpreter so most changes made interactively in the plot window
will not be reflected in the graphics properties managed by Octave. For
example, if the plot window is closed with a mouse click, Octave will not
be notified and will not update its internal list of open figure windows.
The qt toolkit is recommended instead.
#}
set(0, "DefaultAxesTitleFontWeight", "bold")
set(0, "DefaultAxesFontWeight", "bold")
set(0, "DefaultAxesFontSize", 14)
P = 2000; % signal duration
x = 0:P-1; % sampling times
% Any function will do for the signal. It needn't be periodic, but a square wave is convenient.
period=233; % square wave period
s = square((x-period*.67)*2*pi/period);
n = 4; % a harmonic (any harmonic will do)
num_angles=1000; % eval the correlation function at 1000 phases
correl = [];
phi = (0:1:num_angles-1)/num_angles;
for m=phi
% The right-hand side is equivalent to sum(s.*cos(2*pi*(n/P*x - m))
correl(end+1) = real(sum(s.*exp(-i*2*pi*(n/P*x - m))));
endfor
figure("position",[1 1 700 700])
plot(phi*360, correl, "color","b", "linewidth",3)
xlim([0 360]);
set(gca, 'xtick', [0 1 2 3 4]*90);
[maxval,idx] = max(correl);
cossin = sum(s.*exp(i*2*pi*n*x/P))
% The next two things are equal
mod(atan2(imag(cossin), real(cossin))*360/(2*pi), 360)
(idx-1)*360/num_angles
% The next two things are equal
maxval
abs(cossin)
hold on
stem((idx-1)*360/num_angles, correl(idx), "filled", "linewidth",4, "color",[1 0 1], "markerfacecolor",[1 0 1])
stem( 0,correl( 0*num_angles/360+1),"filled", "linewidth",4, "color",[1 0 1], "markerfacecolor", [1 0 1])
stem(90,correl(90*num_angles/360+1),"filled", "linewidth",4, "color",[1 0 1], "markerfacecolor", [1 0 1])
title("Cross-correlation function", "fontsize",14);
xlabel("phase lag (degrees)", "fontsize",14)
ylabel("correlation amplitude", "fontsize",14)
|

|
Diese Datei ist unkategorisiert.
Bitte hilf mit, diese Datei zu verbessern, indem du sie einer oder mehreren passenden Kategorien hinzufügst, sodass sie mit anderen ähnlichen Dateien verbunden ist (wie funktioniert's?). Autoren, die auf diesem Weg Material suchen, können dann viel leichter Passendes für ihr Projekt finden.
Bitte informiere den Benutzer mit {{subst:Please link images|File:Correlation function.svg}} ~~~~ |
Dateiversionen
Klicke auf einen Zeitpunkt, um diese Version zu laden.
| Version vom | Vorschaubild | Maße | Benutzer | Kommentar | |
|---|---|---|---|---|---|
| aktuell | 05:19, 12. Apr. 2022 | | 765 × 765 (69 KB) | wikimediacommons>Bob K | Uploaded own work with UploadWizard |
Dateiverwendung
Die folgende Seite verwendet diese Datei: